How to Quantify Bias with Mock Microbial Community Standards:
MIQ Calculates a Standardized Score
The field of NGS-based microbiome analysis is at a turning point, where key opinion leaders and worldwide consortia are calling for the universal use of well-defined microbial community standards to improve data accuracy and allow for cross-study and inter-lab comparisons1-5. The development of commercially available mock microbial communities has helped increase the use of proper controls, but until now, no simple method existed for quantifying bias when these standards are employed. The Measurement Integrity Quotient (MIQ) score simplifies bias quantification to an easily interpreted, standardized score and report.
What are Mock Microbial Communities?
A mock microbial community standard is a synthetic mix of known microbial species with a specific and accurate percentage of each. Ideally, the species chosen for the standard represent diverse characteristics that present the various challenges that a microbiome study may face. These characteristics include a wide range in cell wall toughness and cell size to challenge cell lysis bias, a spectrum of GC content to test sequencing and bioinformatics bias, and multi-kingdom representation to assess species detection in the different sequencing technologies. These spectra allow for accuracy assessment of microbiome workflows, even if the standard doesn’t contain specific strains of interest. Lynn Schriml of the University of Maryland Institute for Genome Sciences explains: “You’re benchmarking what the analysis is doing, not necessarily what’s in the community.”6
How do Mock Microbial Communities Control for Bias?
The purpose of a mock microbial community standard is to be used as a positive control, run as a unique sample in parallel to study samples. Ideally, this positive control is included with every nucleic acid extraction to detect any deviations in lysis and purification steps. If the observed relative abundances of the standard do not resemble the expected, biases introduced in the workflow may have caused the shift in the standard and in the unknown samples as well. Many studies are now adopting this strategy including several high profile publications7-9.
Bias Quantified with a Simple Score - MIQ drop
Although the field is beginning to adopt proper controls, no simple solution existed for a thorough, quantitative analysis of accuracy. This issue has been mentioned by key opinion leaders and was a common discussion at the 2019 NIST Workshop on Standards for Microbiome Measurements10. Now, the MIQ score system addresses these problems by making the analysis of a microbial standard easy, fully reproducible, and subject to a grading scheme sensitive even to smaller biases introduced by microbiome preparation methods.
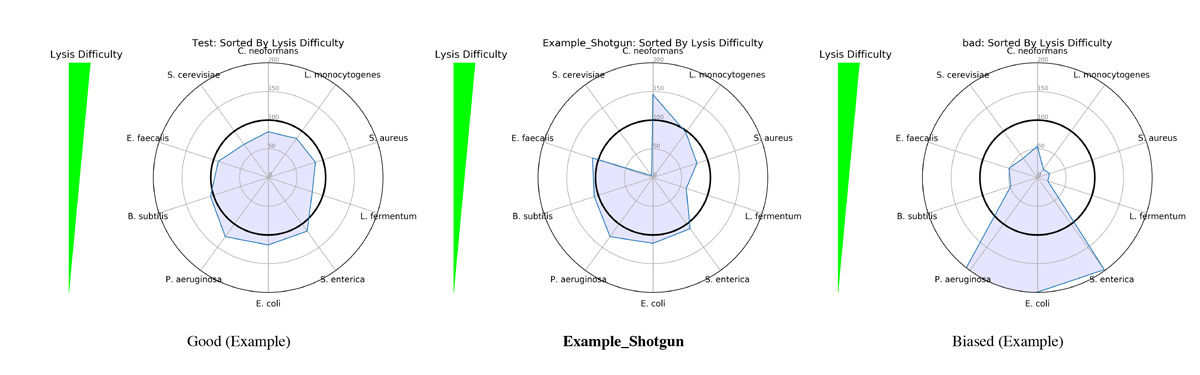
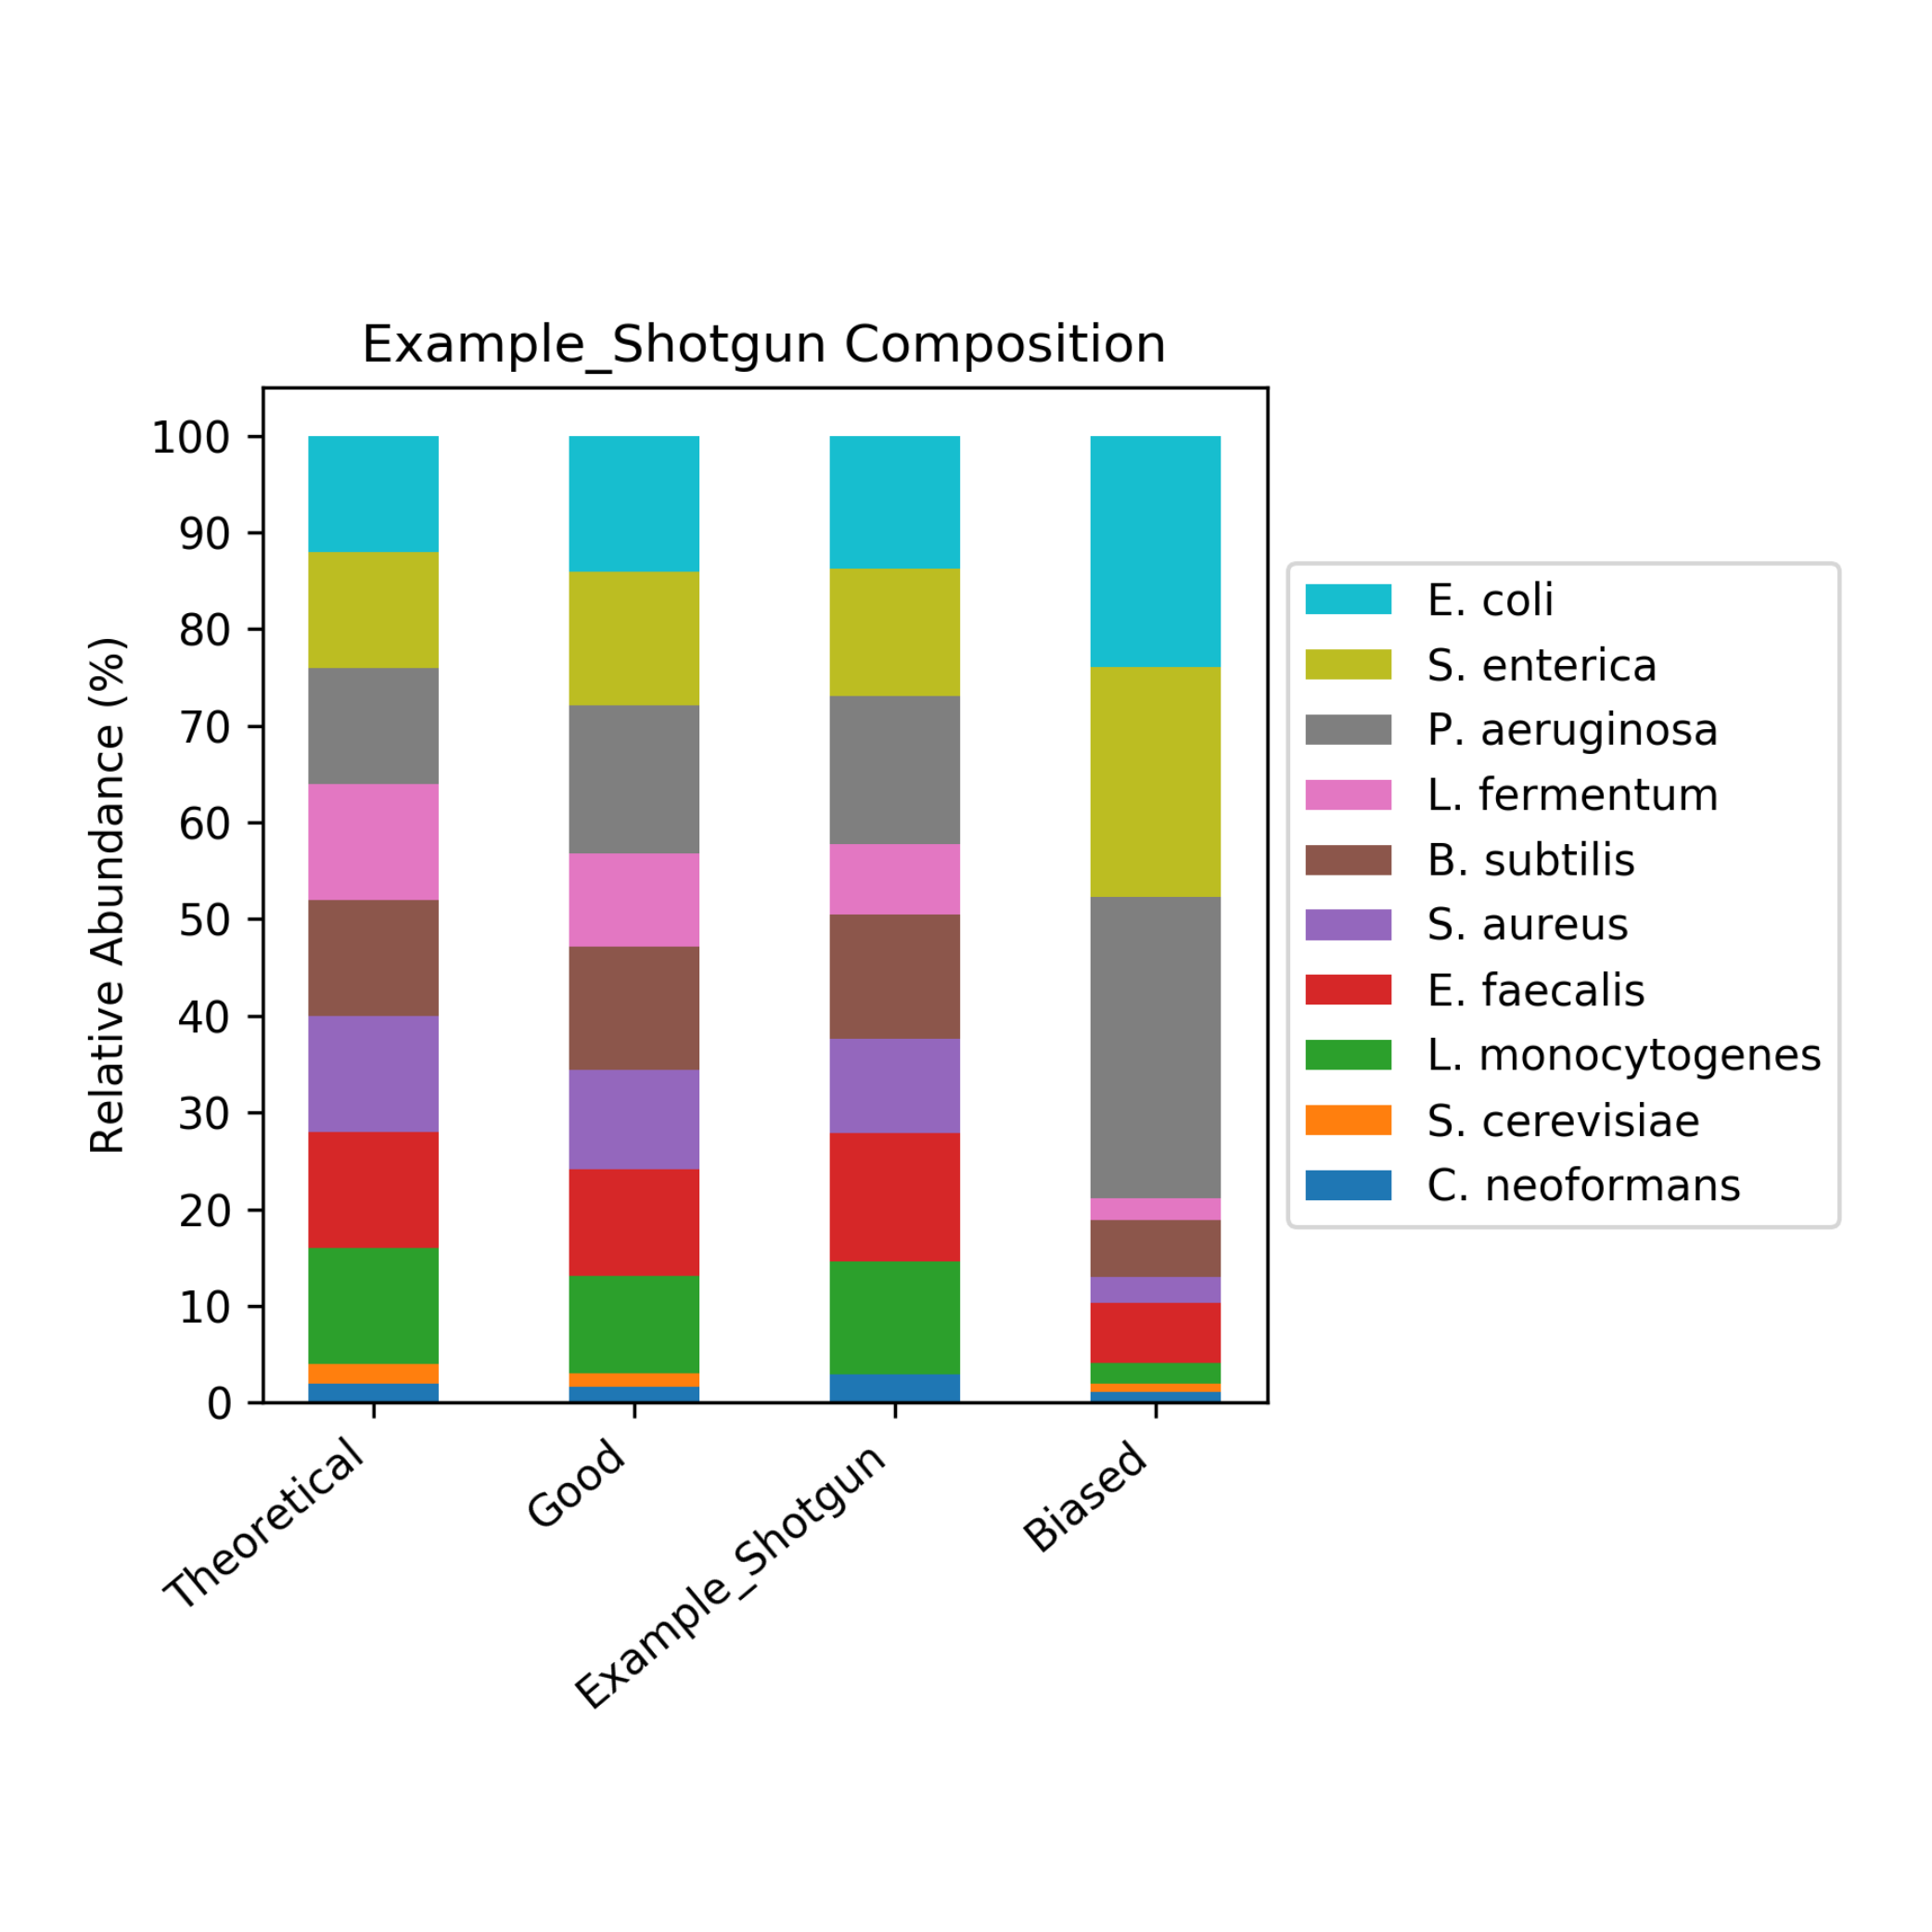
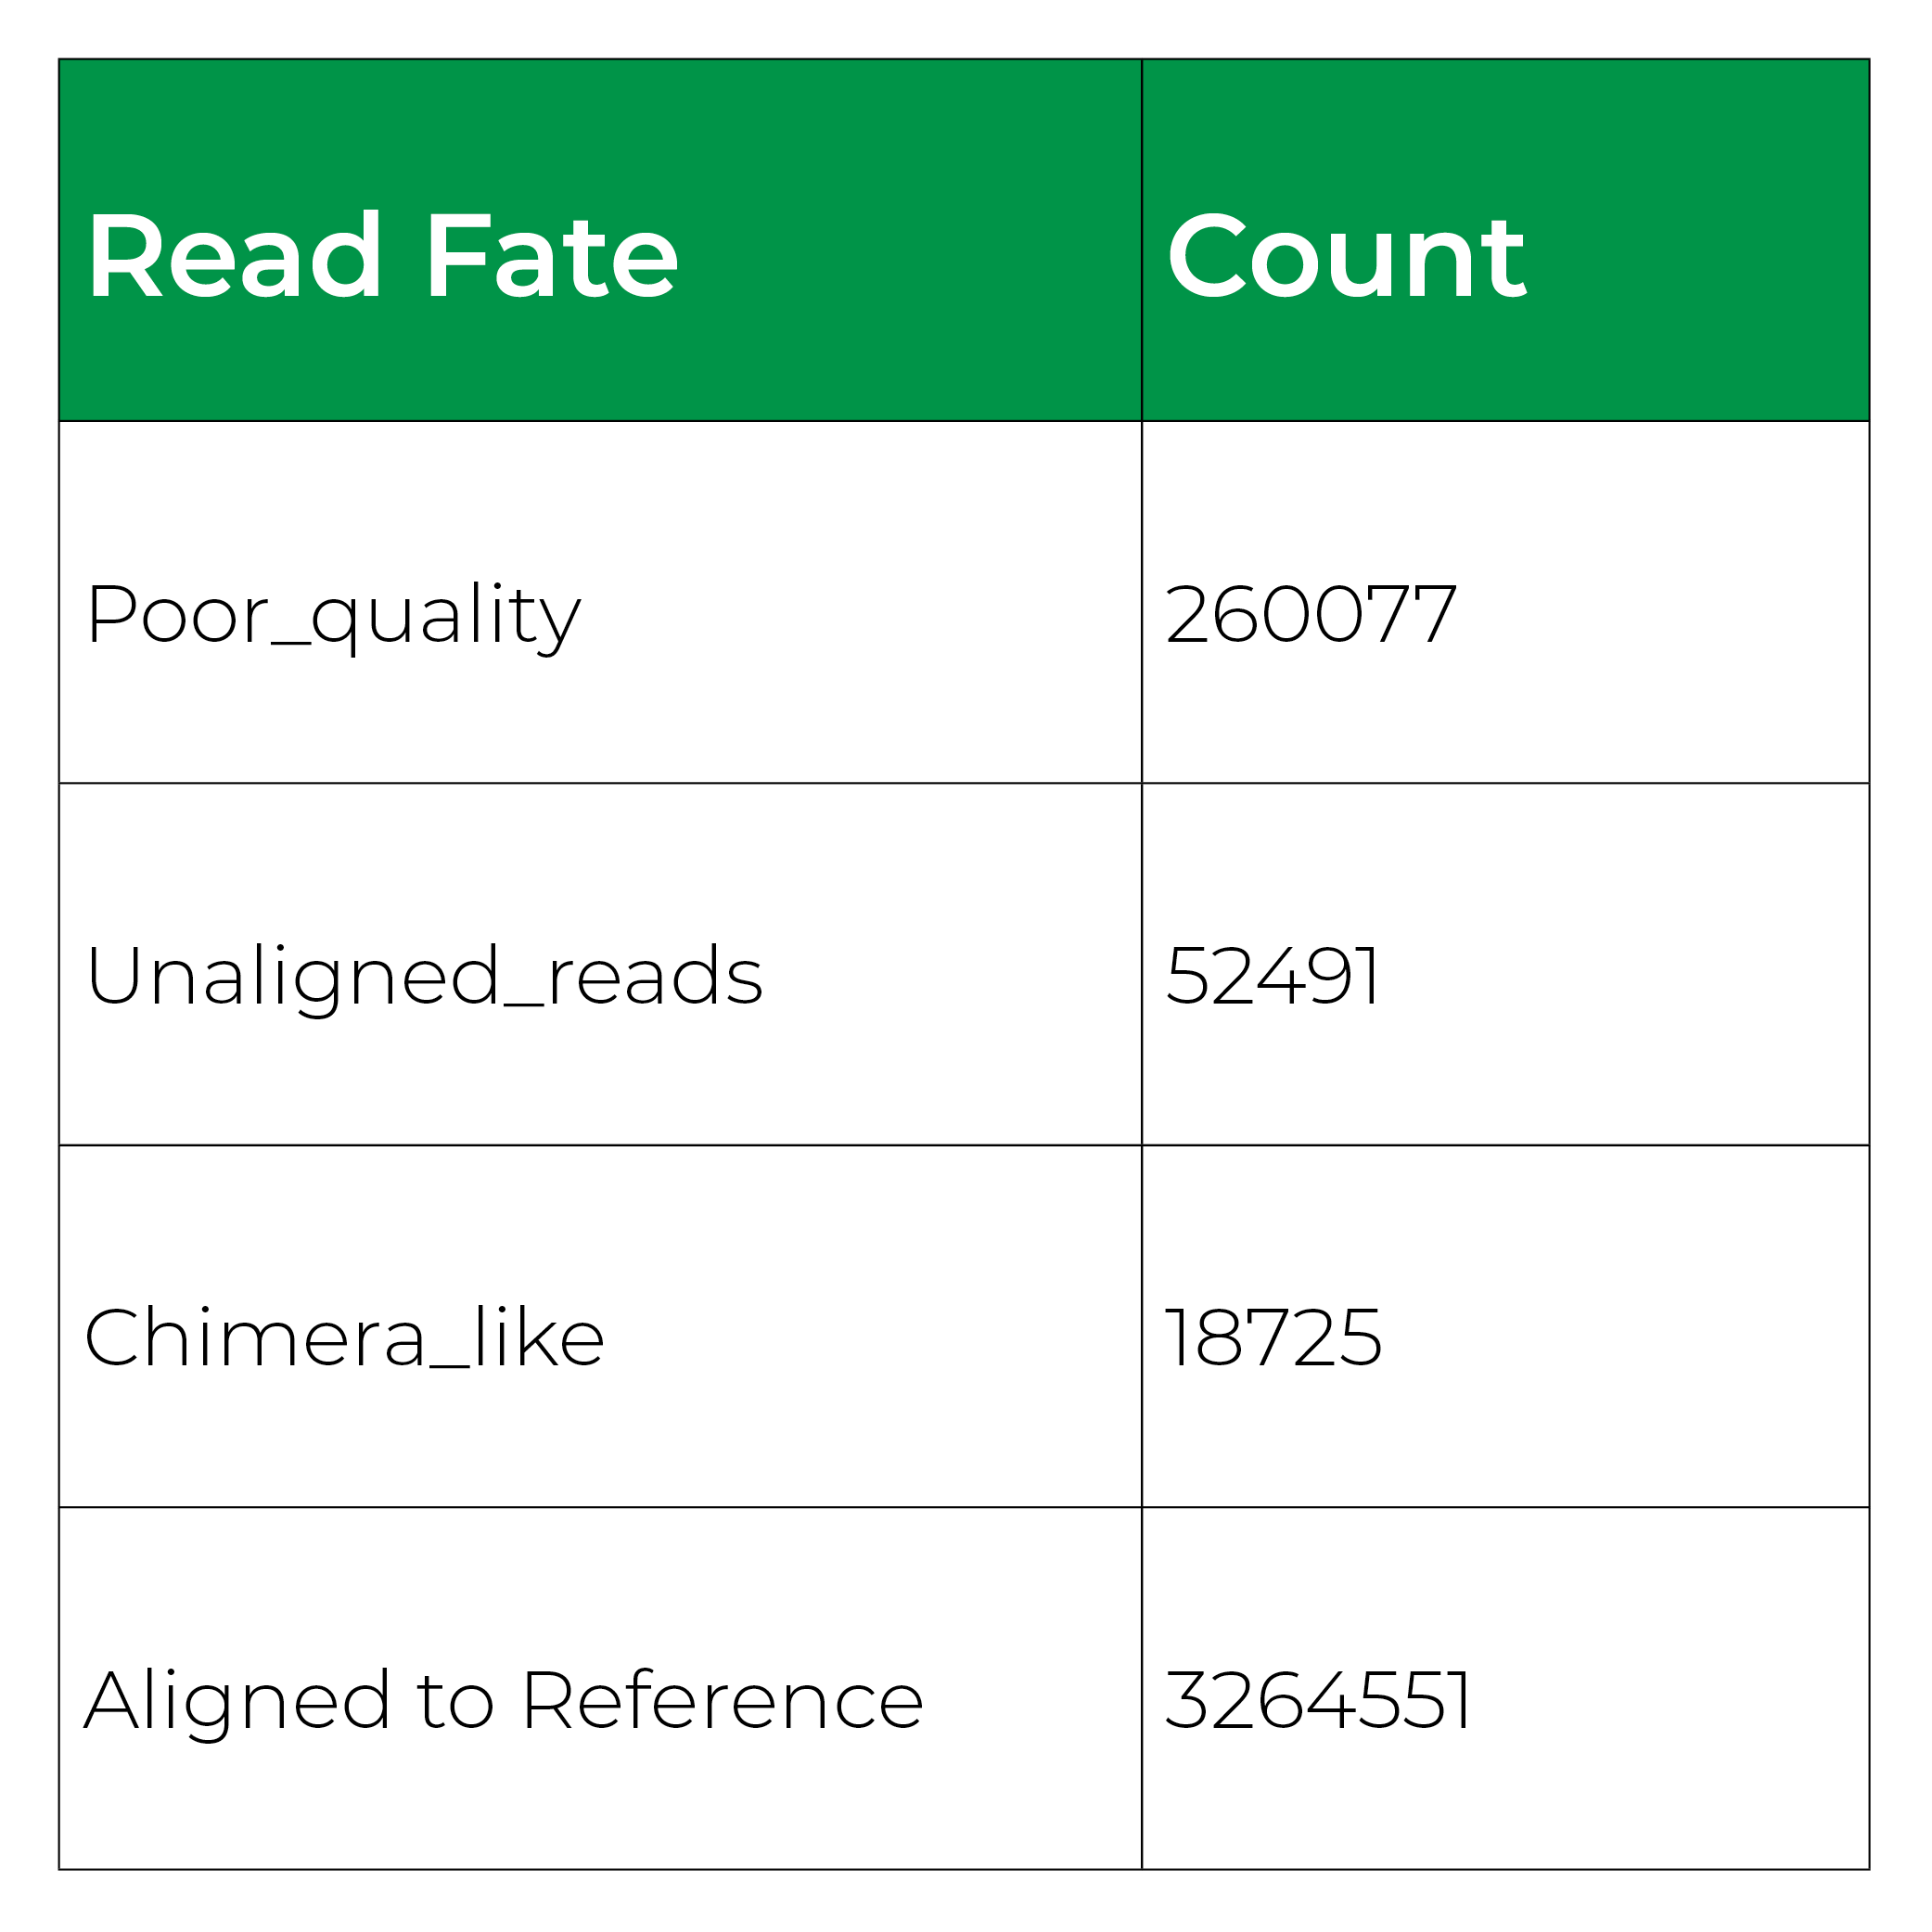
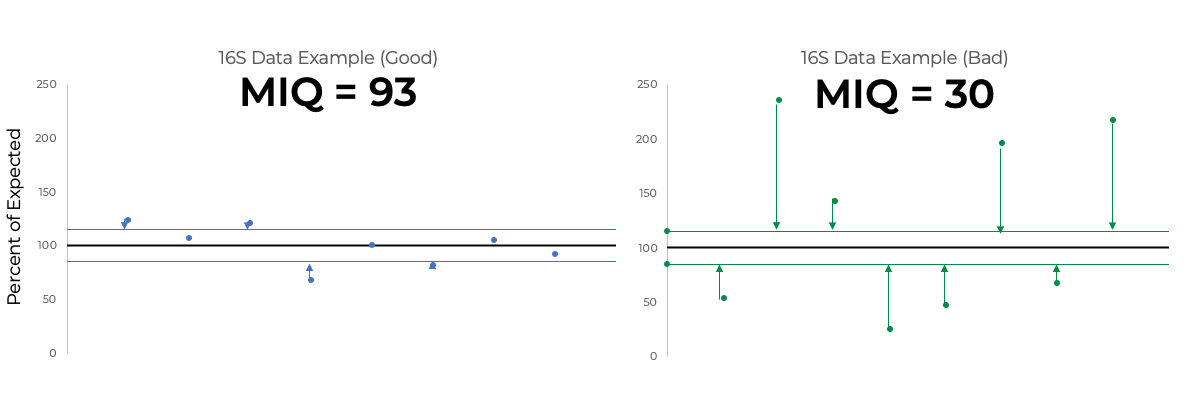
It began as a joke to name the application after the scientist who created it (Mike) but, it turned out that Measurement Integrity Quotient perfectly describes what the score measures. The MIQ score simplifies bias assessment by assigning a score from 0 to 100 and can be interpreted like a grade on a high school exam, with >90 being excellent, 80-89 being good, and so on (Figure 1). This is achieved by measuring the fidelity of measured relative abundances compared to a known input. The MIQ score is presented in a user-friendly report which also includes different plots to visually represent the evaluation. These include radar plots, taxa bar plots, and read fate counts (Figure 2).

How is the MIQ Score Calculated?
The first step in assessing bias using a mock microbial community standard is understanding the manufacturing tolerance of the standard being used. Manufacturing tolerance is the potential variation of a species away from its intended abundance. For example, the manufacturing tolerance of the ZymoBIOMICS Microbial Community Standard is 15%, meaning if 10 cells out of 100 are intended to be B. subtilis cells, the actual cell count for B. subtilis may range from 8.5 to 11.5 cells. It is important to use a standard with minimal manufacturing tolerance like the ZymoBIOMICS Microbial Community Standard, because the assessment of a measurement’s accuracy is only as good as its controls.
The MIQ score measures deviations from the expected relative abundance which cannot be explained by manufacturing tolerance. It does so by first assigning 100% as the percentage of expected for each species in the standard. Using the ZymoBIOMICS Microbial Community Standard’s manufacturing tolerance, any observed relative abundance that falls outside of 15% of the expected percentage has deviation that cannot be explained by manufacturing tolerance (Figure 3). Therefore, its deviation can be assumed to have been caused by one or multiple workflow biases. On the other hand, if observed abundance falls within the band of manufacturing tolerance, it likely did not experience any biases that would cause deviation (Figure 3).
The MIQ score is assigned by measuring the root mean square error (RMSE) of observed abundances that fall outside the band of manufacturing tolerance. RMSE is a commonly used statistical tool used to measure accuracy relative to a known quantity. These RMSEs are then subtracted from 100 to create the MIQ score.
Striving to Improve Microbiome Research
As part of Zymo Research’s effort to improve microbiome data quality and reproducibility, the MIQ Score applications are available to all researchers for free. Versions for 16S and Shotgun data can be downloaded as source code from Zymo Research’s GitHub page or as pre-built Docker images.
Analyze Your Mock Community Data Today with the MIQ Score
Go To MIQ Score AppsReferences
- Sinha R, Abnet CC, White O, Knight R, Huttenhower C: The microbiome quality control project: baseline study design and future directions. Genome Biol 2015, 16:276
- Costea PI, Hildebrand F, Arumugam M, Bäckhed F, Blaser M, Bushman FD, de Vos WM, Ehrlich SD, Fraser CM, Hattori M et al: Enterotypes in the landscape of gut microbial community composition. Nature Microbiology 2018, 3(1):8-16
- Stulberg E, Fravel D, Proctor LM, Murray DM, LoTempio J, Chrisey L, Garland J, Goodwin K, Graber J, Harris MC et al: An assessment of US Microbiome Research. Nature Microbiology 2016, 1:15015
- Jackson SA, Kralj JG, Lin NJ. Report on the NIST/DHS/FDA Workshop: Standards for Pathogen Detection for Biosurveillance and Clinical Applications. NIST.gov 2018, Special Publication (NIST SP) – 1222
- Jones MB, Highlander SK, Anderson EL, Li W, Dayrit M, Klitgord N, Fabani MM, Seguritan V, Green J, Pride DT. Library preparation methodology can influence genomic and functional predictions in human microbiome research. PNAS 2015, 112(45):14024-14029
- Zymo Research. From Gut Instinct to Gold Standard. 2018.
- Danko D, et al. A global metagenomic map of urban microbiomes and antimicrobial resistance. Cell 2021, 184(13): 3376-3393.
- Karst S , Ziels R, Kirkegaard R, Sørensen E, McDonald D, Zhu Q, Knight R, Albertsen M. High-accuracy long-read amplicon sequences using unique molecular identifiers with Nanopore or PacBio sequencing. Nature Methods 2021, 18: 165-169.
- Bullman S, Pedamallu CS, Sicinska E, Clancy TE, Zhang X, Cai D, Neuberg D, Huang K, Guevara F, Nelson T, Chipashvili O, et al. Analysis of Fusobacterium persistence and antibiotic response in colorectal cancer. Science 2017, 358(6369):1443-1148
- 2019 NIST Workshop on Standards for Microbiome Measurements


